

The Victoria Real Estate Board has released their statistics for the month of March. The following is an excerpt from their press release.
A total of 579 properties sold in the Victoria Real Estate Board region this March, 5.5 per cent fewer than the 613 properties sold in March 2025 and 24.5 per cent more than in February 2026. Sales of condominiums decreased by 18.8 per cent from March 2025 with 164 units sold. Sales of single family homes decreased by 2.4 per cent from March 2025 with 285 sold.
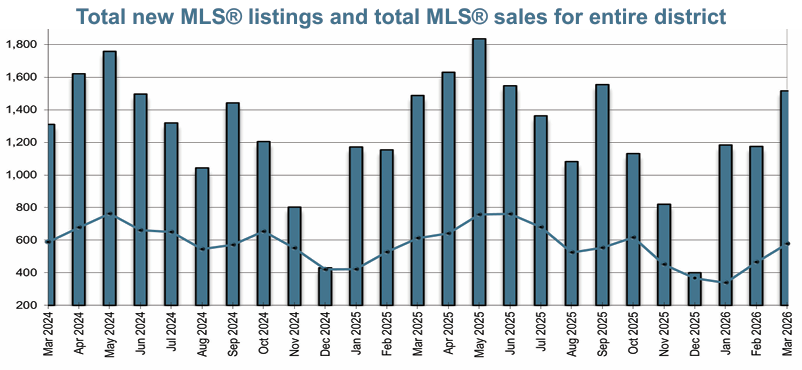
“Our market is following a fairly typical spring market trend,” said Victoria Real Estate Board Chair Fergus Kyne. “With sales and listings both increasing from the previous month, we’re tracking a seasonal pattern that generally builds to the peak of the market in May or June.”
There were 3,261 active listings for sale on the Victoria Real Estate Board Multiple Listing Service® at the end of March 2026, an increase of 12.3 per cent compared to the previous month of February and a 7.9 per cent increase from the 3,023 active listings for sale at the end of March 2025.
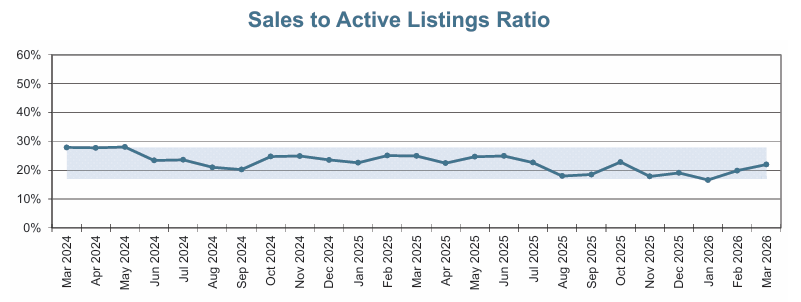
This chart tracks the ratio of total residential sales over total active residential listings at month-end for each of the last 25 months.
The active listing count and the sales count can be viewed as indicators of housing supply and demand respectively. Observing the ratio between them can thus help indicate a "buyers' market", where there is sustained downward pressure on prices, and a "sellers' market", where there is sustained upward pressure on prices.
- below 17%, there is downward pressure on prices (buyers' market)
- above 28%, there is upward pressure on prices (sellers' market)
- in the 17-28% range, there is little pressure on prices either way (balanced market)