

The Victoria Real Estate Board has released their statistics for the month of February. The following is an excerpt from their press release.
A total of 465 properties sold in the Victoria Real Estate Board region this February, 11.9 per cent fewer than the 528 properties sold in February 2025 and 37.2 per cent more than in January 2026. Sales of condominiums decreased by 19.8 per cent from February 2025 with 154 units sold. Sales of single family homes decreased by 12 per cent from February 2025 with 206 sold.
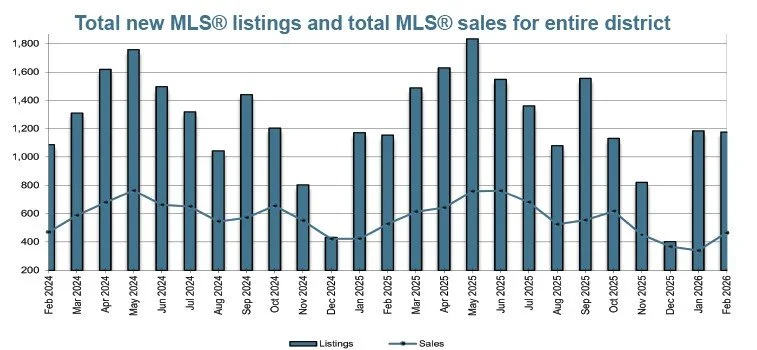
"February's sales definitely picked up the pace compared with sales from the previous month,” said Victoria Real Estate Board Chair Fergus Kyne. "Though our sales numbers are lower than they were in 2025, with an over 35 per cent increase month over month, and a very healthy amount of inventory currently available, it will be interesting to see how our spring market unfolds in the upcoming months."
There were 2,903 active listings for sale on the Victoria Real Estate Board Multiple Listing Service® at the end of February 2026, an increase of 10.6 per cent compared to the previous month of January and a 10.4 per cent increase from the 2,630 active listings for sale at the end of February 2025.
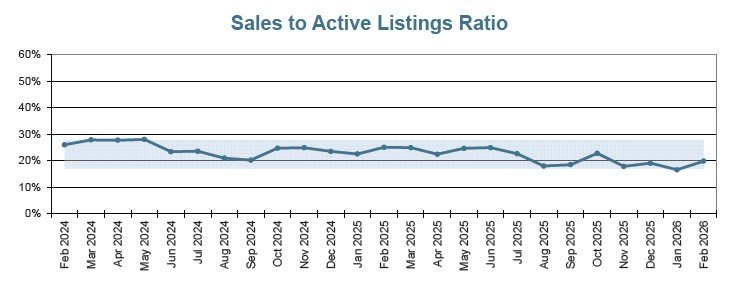
This chart tracks the ratio of total residential sales over total active residential listings at month-end for each of the last 25 months.
The active listing count and the sales count can be viewed as indicators of housing supply and demand respectively. Observing the ratio between them can thus help indicate a "buyers' market", where there is sustained downward pressure on prices, and a "sellers' market", where there is sustained upward pressure on prices.
- below 17%, there is downward pressure on prices (buyers' market)
- above 28%, there is upward pressure on prices (sellers' market)
- in the 17-28% range, there is little pressure on prices either way (balanced market)